Note
Go to the end to download the full example code.
Plotting a Convective System using CVD Friendly Colormaps#
This is an example of using both HomeyerRainbow and ChaseSpectral CVD friendly colormaps for a convective system in Oklahoma.
print(__doc__)

# Author: Zach Sherman
# License: BSD 3 clause

import matplotlib.pyplot as plt
import pyart
from open_radar_data import DATASETS

import cmweather  # noqa
## You are using the Python ARM Radar Toolkit (Py-ART), an open source
## library for working with weather radar data. Py-ART is partly
## supported by the U.S. Department of Energy as part of the Atmospheric
## Radiation Measurement (ARM) Climate Research Facility, an Office of
## Science user facility.
##
## If you use this software to prepare a publication, please cite:
##
##     JJ Helmus and SM Collis, JORS 2016, doi: 10.5334/jors.119
Download and read in the data
First we will read in the example data from the repository open_radar_data by using a built in fetch function to download the data.
Downloading file '110635.nc' from 'https://github.com/openradar/open-radar-data/raw/main/data/110635.nc' to '/home/docs/.cache/open-radar-data'.
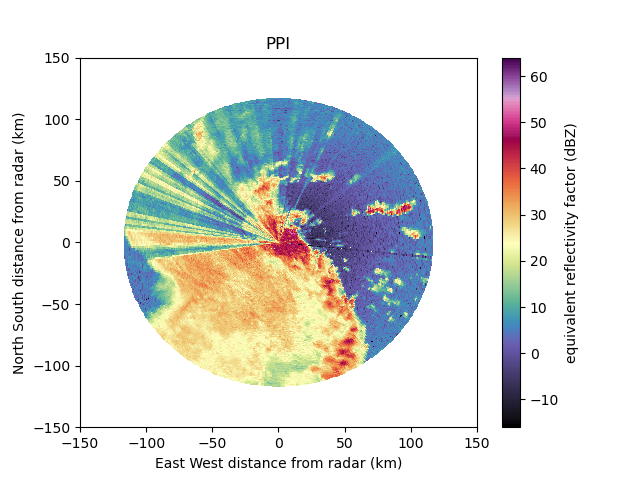
Color Vision Deficiency (CVD) Friendly Colormap HomeyerRainbow
Let’s visualize the HomeyerRainbow CVD friendly colormap for the reflectivity moment in our data.
# create the plot using RadarDisplay
display = pyart.graph.RadarDisplay(radar)
fig = plt.figure()
display.plot(
    'reflectivity',
    0,
    vmin=-16.0,
    vmax=64,
    title='PPI',
    cmap='HomeyerRainbow',
    gatefilter=gatefilter,
)
display.set_limits(ylim=[-150, 150], xlim=[-150, 150])
plt.show()

Color Vision Deficiency (CVD) Friendly Colormap ChaseSpectral
Similar to the previous example, let’s visualize the ChaseSpectral CVD friendly colormap
# create the plot using RadarDisplay
display = pyart.graph.RadarDisplay(radar)
fig = plt.figure()
display.plot(
    'reflectivity',
    0,
    vmin=-16.0,
    vmax=64,
    title='PPI',
    cmap='ChaseSpectral',
    gatefilter=gatefilter,
)
display.set_limits(ylim=[-150, 150], xlim=[-150, 150])
plt.show()
Total running time of the script: (0 minutes 2.115 seconds)